Master Trend Analysis Techniques for Better Insights


Discover top trend analysis techniques to identify and leverage trends effectively in 2025. Enhance your decision-making skills today!
Riding the Wave of Data: Understanding Trend Analysis
Want to spot the next big thing? This listicle reveals eight powerful trend analysis techniques to help you understand and capitalize on market shifts. Learn how to use methods like moving averages, regression analysis, seasonal decomposition, ARIMA, exponential smoothing, pattern recognition, wavelet analysis, and Trend Impact Analysis (TIA) to extract actionable insights from data. Mastering these trend analysis techniques provides a crucial edge for aspiring entrepreneurs, innovators, and business owners seeking data-driven decisions.
1. Moving Average Analysis
Moving average analysis is a fundamental trend analysis technique that smooths out fluctuations in data, making underlying trends easier to spot. It works by creating a constantly updated average value over a specific time period. This effectively filters out short-term noise and highlights the direction of the trend. Whether you're tracking stock prices, sales figures, or economic indicators, moving average analysis provides a simple yet powerful way to understand historical data and gain insights for future decision-making. This technique rightfully earns its place in any trend analysis toolkit because of its versatility, ease of use, and proven effectiveness. It's a cornerstone of technical analysis and widely applicable across various domains.
The core feature of moving average analysis lies in its rolling calculation. For a 10-day moving average, for instance, you calculate the average of the last 10 days' data. Each day, the oldest data point drops out, and the newest data point is included, creating a "moving" average. Several variations exist, each with its own weighting method:
- Simple Moving Average (SMA): Averages all data points in the period equally.
- Exponential Moving Average (EMA): Gives more weight to recent data points, making it more responsive to new information.
- Weighted Moving Average (WMA): Assigns different weights to data points within the period, often linearly decreasing with age.
The choice of moving average type and time period depends on your specific needs and the nature of the data. You can apply this technique to daily, weekly, monthly, or any other timeframe. Often, analysts use multiple moving averages with different periods simultaneously (e.g., a 50-day and a 200-day moving average) to identify potential trend shifts and generate trading signals.
Pros:
- Simple to Calculate and Interpret: Basic arithmetic is all you need.
- Effective Smoothing: Filters out random price fluctuations and market noise.
- Trend Identification: Clearly reveals the direction of the current trend.
- Reversal Signals: Can indicate potential trend reversals.
- Adaptable: Works with various data types and timeframes.
Cons:
- Lagging Indicator: Reacts to past price movements, not future ones. Longer periods create more lag.
- False Signals: Can generate incorrect signals in choppy or sideways markets.
- Limited Predictive Power: Better for identifying current trends than predicting future ones.
- Variability of Results: Different moving averages can yield different interpretations.
Examples:
- Stock Market: Traders use 50-day and 200-day moving averages to identify bull and bear markets. A crossover, where the shorter-term average crosses above the longer-term average, is often seen as a bullish signal.
- Retail Sales: Businesses might track 3-month moving averages of sales data to identify seasonal trends and adjust inventory levels accordingly.
- Economic Analysis: Economists may analyze moving averages of unemployment data to spot economic cycles and turning points.
Tips for Aspiring Entrepreneurs and Business Owners:
- Short-Term vs. Long-Term: Use shorter periods (e.g., 10-day) for short-term analysis and longer periods (e.g., 200-day) for long-term trend identification.
- EMA for Recent Data: Consider using EMAs when recent data is more relevant.
- Crossover Signals: Look for crossovers between different moving averages as potential buy or sell signals (in conjunction with other indicators).
- Confirmation is Key: Combine moving average analysis with other trend analysis techniques and indicators for confirmation before making crucial business decisions.
Moving average analysis, popularized by figures like Charles Dow and refined by technical analysts like John Murphy and Martin Pring, remains a timeless and valuable tool for anyone seeking to understand trends and make data-driven decisions. Its simplicity and applicability make it an essential technique for aspiring entrepreneurs, startup founders, and established business owners alike.
2. Regression Analysis
Regression analysis is a powerful statistical method used in trend analysis to uncover and quantify relationships between variables. Specifically, it examines how a dependent variable changes in response to modifications in one or more independent variables. This allows us to not only understand past trends but also, importantly, predict future values based on historical patterns. As aspiring entrepreneurs, startup founders, and business innovators, understanding these patterns can be crucial for making informed decisions.
How It Works:
Regression analysis aims to find the best-fitting line or curve through a set of data points. This "line of best fit" represents the relationship between the variables. The equation of this line can then be used to predict the value of the dependent variable based on given values of the independent variables.
Types of Regression:
- Linear Regression: This is the simplest form, where the relationship between variables is assumed to be linear (a straight line). It’s a good starting point for many trend analyses.
- Multiple Regression: This expands on linear regression by considering the impact of multiple independent variables on the dependent variable. For instance, you might analyze how both marketing spend and price affect sales.
- Polynomial Regression: When relationships are non-linear (curved), polynomial regression fits a curve to the data, capturing more complex trends.
Features and Benefits:
Regression analysis goes beyond simply identifying a trend; it quantifies the relationship with specific coefficients, providing a measurable understanding of the impact each independent variable has. It also provides statistical measures like R-squared and p-values, which indicate the quality of the fit and the significance of the relationship. This allows for a more robust and reliable analysis compared to simply observing a trend visually.
Pros:
- Quantifiable Relationships: Provides specific coefficients that quantify the influence of each independent variable.
- Statistical Confidence: Offers statistical measures (R-squared, p-values) to assess the reliability of the identified trends.
- Predictive Power: Can be used for forecasting future values based on historical data.
- Handles Complexity: Accommodates multiple variables and complex relationships.
- Widely Accepted: A standard and recognized method in both academic and business settings.
Cons:
- Assumptions: Relies on certain statistical assumptions about the data, which might not always hold true.
- Sensitivity to Outliers: Extreme values in the data can disproportionately influence the results.
- Oversimplification: May oversimplify complex real-world relationships.
- Correlation vs. Causation: Just because a relationship is identified doesn't mean one variable causes the change in the other.
- Requires Statistical Knowledge: Proper implementation and interpretation require some statistical expertise.
Examples of Successful Implementation:
- Economics: Analyzing the relationship between GDP growth and unemployment rates.
- Marketing: Understanding the impact of advertising spending on sales figures.
- Climate Science: Analyzing temperature trends over time.
- Small Business: Predicting customer demand based on past sales data and economic indicators.
- Startups: Assessing the effectiveness of different marketing campaigns on user acquisition.
Actionable Tips for Using Regression Analysis:
- Start Simple: Begin with linear regression before exploring more complex models.
- Check Residuals: Examine residual plots to ensure the statistical assumptions are met.
- Use Adjusted R-squared: Use adjusted R-squared when comparing models with different numbers of variables.
- Transform Variables: Consider transforming variables (e.g., using logarithms or square roots) if relationships appear non-linear.
- Validate Predictions: Test your model's accuracy with out-of-sample data – data the model hasn't seen before.
Why Regression Analysis Deserves its Place in Trend Analysis:
Regression analysis earns its spot on this list due to its ability to move beyond simple observation and provide a robust, quantifiable understanding of trends. Its capacity to predict future values based on historical data is particularly valuable for business planning, making it an essential tool for entrepreneurs, startup founders, and business innovators looking to capitalize on emerging trends. While some statistical knowledge is required, the benefits of accurate trend prediction and insightful relationship analysis make it well worth the effort.
3. Seasonal Decomposition
Seasonal decomposition is a powerful trend analysis technique that allows you to dissect time series data into its core components: trend, seasonality, cyclical patterns, and random noise. This method is invaluable for businesses dealing with data exhibiting regular seasonal fluctuations, like retail sales, tourism, or agricultural production. By separating these components, you can gain a clearer understanding of the underlying trends and isolate them from predictable seasonal variations, leading to better decision-making. For aspiring entrepreneurs, startup founders, and small business owners, understanding these nuances can be the key to accurate forecasting and effective strategy.
The following infographic visualizes the process of seasonal decomposition, breaking down how a time series is separated into its constituent parts.
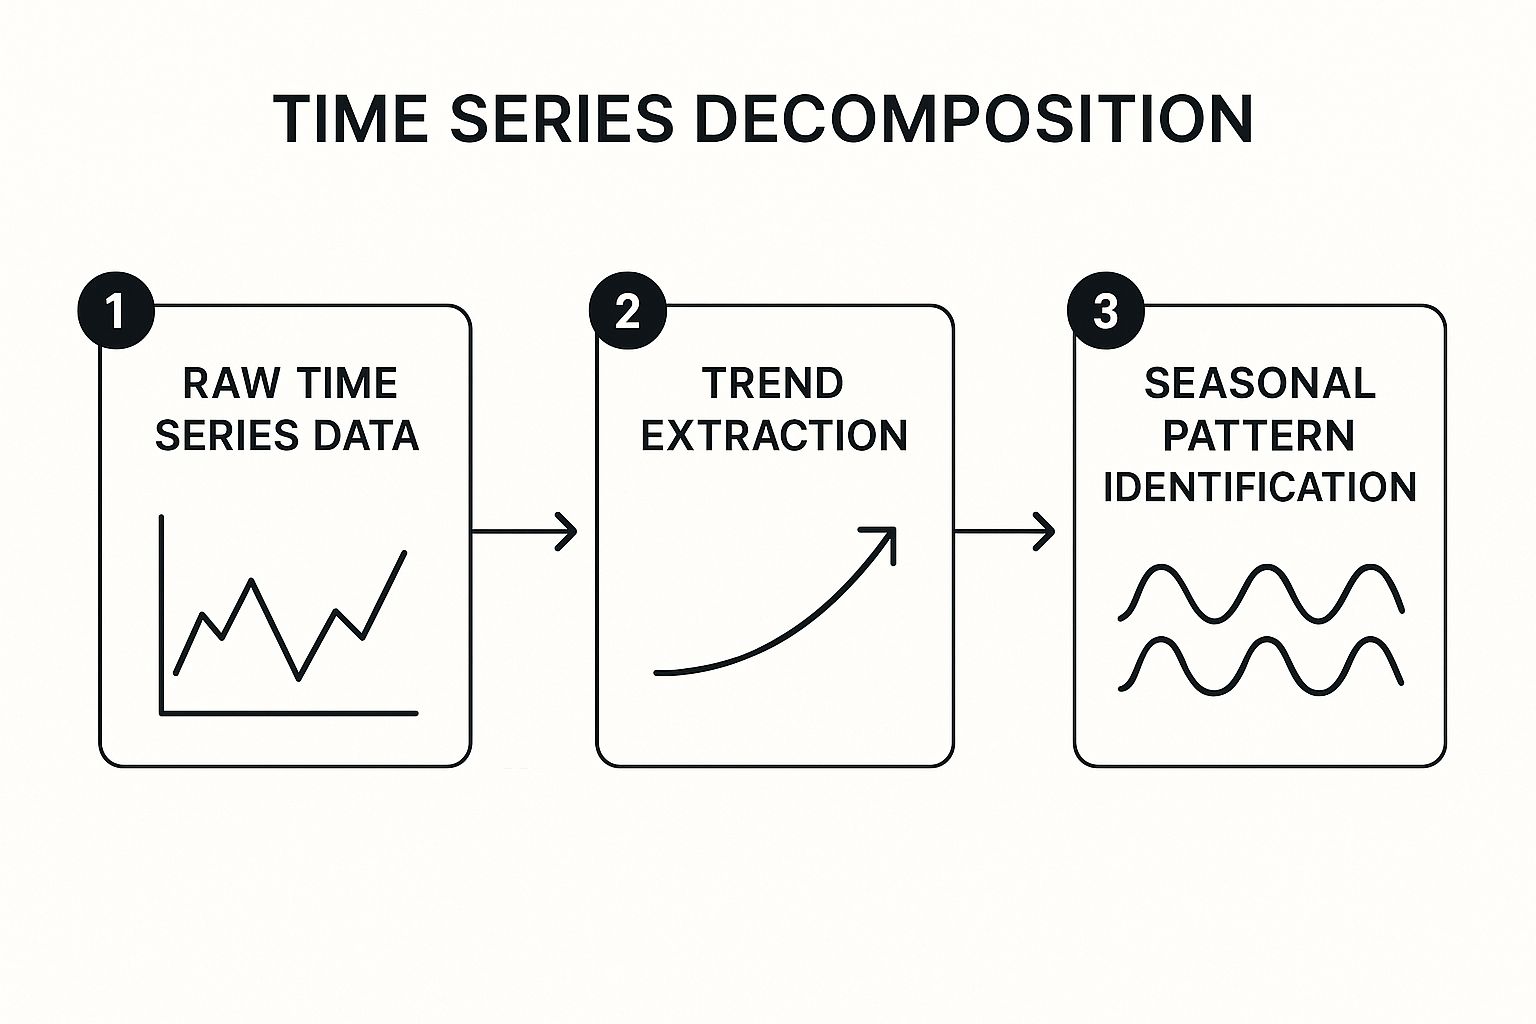
The infographic clearly illustrates how the original time series data is broken down into its trend, seasonal, and residual components, then recombined (with the seasonal component removed) to reveal the seasonally adjusted trend. This visualization highlights the core purpose of seasonal decomposition: isolating the underlying trend by filtering out the "noise" of seasonal fluctuations.
How Seasonal Decomposition Works:
The process starts with a time series dataset. The decomposition technique then separates the data into the following components:
- Trend: The underlying long-term direction of the data, increasing, decreasing, or remaining stable.
- Seasonality: Regular, repeating patterns within a fixed period (e.g., a spike in ice cream sales every summer).
- Cyclical Patterns: Fluctuations that occur over longer, irregular periods, often tied to economic cycles or other external factors. These are harder to predict than seasonal patterns.
- Random Noise (or Irregular Component): Unpredictable fluctuations in the data due to random events.
Two main decomposition methods exist: additive and multiplicative. Additive decomposition assumes the components are added together to form the time series, while multiplicative decomposition assumes they are multiplied. The choice depends on whether the seasonal variation is constant or changes with the level of the trend.
Features and Benefits of Seasonal Decomposition:
- Clear Component Separation: Provides a clear visualization of each component’s contribution to the overall time series.
- Method Flexibility: Offers both additive and multiplicative decomposition methods to suit different data characteristics.
- Robust Algorithms: Often utilizes established algorithms like STL (Seasonal-Trend decomposition using LOESS) or X-12-ARIMA for accurate decomposition.
- Improved Forecasting: Enables more accurate forecasting by modeling each component separately.
- Meaningful Comparisons: Allows for accurate season-over-season comparisons, eliminating the distortion caused by seasonal variations.
Pros and Cons:
- Pros: Reveals true underlying trends, quantifies the impact of seasonality, improves forecasting accuracy, enables season-over-season comparisons.
- Cons: Requires sufficient historical data, assumes consistent seasonality, may struggle with irregular patterns, can be computationally intensive for large datasets.
When and Why to Use Seasonal Decomposition:
Use this trend analysis technique when you need to:
- Identify underlying trends: Separate real growth or decline from seasonal fluctuations.
- Understand seasonal impact: Quantify the magnitude and timing of seasonal effects.
- Improve forecasting: Build more accurate predictive models by accounting for seasonality.
- Make informed comparisons: Compare performance across different seasons effectively.
Examples of Successful Implementation:
- Retail: Analyze sales data to distinguish between holiday sales spikes and actual growth trends.
- Energy: Decompose electricity usage to separate seasonal demand from long-term consumption patterns.
- Tourism: Understand visitor patterns throughout the year to optimize marketing campaigns and resource allocation.
Actionable Tips:
- Choose the right method: Use multiplicative decomposition when seasonal variations increase with the trend level.
- Determine the seasonal period: Identify the appropriate seasonal cycle (monthly, quarterly, etc.) based on your data.
- Adjust for seasonality: Apply seasonal adjustment before comparing data across different seasons.
- Monitor for change: Check for changing seasonal patterns over time and adjust your approach if necessary.
By leveraging seasonal decomposition effectively, businesses can gain a more profound understanding of their data and make more informed, strategic decisions. This powerful technique provides a critical lens for analyzing time series data, enabling you to see beyond the surface fluctuations and grasp the true underlying dynamics of your business.
4. ARIMA (AutoRegressive Integrated Moving Average)
ARIMA is a powerful statistical method used for analyzing and forecasting time-based data, making it a valuable trend analysis technique for entrepreneurs, business owners, and market researchers. It's particularly useful for understanding patterns and making predictions about future values in datasets that exhibit trends and seasonality, like sales figures, stock prices, or website traffic. ARIMA works by combining three core components: autoregression (AR), integrated (I), and moving average (MA). Autoregression uses past values of the data to predict future values, much like a regression model. The integrated component handles trends by differencing the data, essentially looking at the changes between data points rather than the raw values themselves. This makes the data stationary, a key requirement for ARIMA. Finally, the moving average component considers past forecast errors to refine future predictions.

ARIMA models are represented as ARIMA(p,d,q), where 'p' is the order of the autoregressive component, 'd' is the degree of differencing, and 'q' is the order of the moving average component. Finding the right combination of p, d, and q is crucial for accurate modeling. This is often done using the Box-Jenkins methodology, which involves analyzing autocorrelation and partial autocorrelation plots.
Why ARIMA Deserves Its Place in Trend Analysis:
ARIMA's strength lies in its flexibility and ability to capture complex temporal dependencies in data. Unlike simpler methods, it can model both short-term and long-term patterns, making it suitable for a wide range of business applications. Moreover, it provides statistical confidence intervals for forecasts, allowing users to assess the uncertainty associated with their predictions.
Features and Benefits:
- Combines AR, I, and MA components: This allows ARIMA to model a variety of time series patterns.
- Handles non-stationary data: The integrated component makes ARIMA applicable to data with trends.
- Provides statistical confidence intervals: Gives a measure of the reliability of the forecasts.
- Can be extended to SARIMA: Handles seasonality by incorporating seasonal components.
Pros and Cons:
- Pros: Highly flexible, accurate forecasting, captures complex patterns, well-established theoretical foundation.
- Cons: Requires statistical expertise, assumes linear relationships, can be computationally intensive, needs sufficient historical data.
Examples of Successful Implementation:
- Economic Forecasting: Central banks use ARIMA to forecast key economic indicators like inflation and GDP growth.
- Demand Prediction: Utility companies use ARIMA models to predict energy demand, optimizing resource allocation.
- Financial Analysis: Analysts employ ARIMA to forecast stock prices and market volatility, informing investment decisions.
Actionable Tips for Using ARIMA:
- Test for Stationarity: Use tests like the Augmented Dickey-Fuller (ADF) or KPSS test before applying ARIMA.
- Use ACF and PACF Plots: These plots help identify potential p and q values for the model.
- Compare Models: Use information criteria like AIC or BIC to compare the performance of different ARIMA models.
- Validate Your Model: Check the residuals for randomness to ensure the model has captured the underlying patterns.
- Consider SARIMA for Seasonal Data: If your data exhibits seasonal patterns, use Seasonal ARIMA (SARIMA).
When and Why to Use ARIMA:
Use ARIMA when dealing with time-series data that exhibits trends and/or seasonality, and you need to make forecasts based on past patterns. It's particularly useful when simpler methods like moving averages are insufficient to capture the complexity of the data. While requiring some statistical understanding, ARIMA offers powerful insights for informed decision-making in various business contexts.
5. Exponential Smoothing: A Powerful Trend Analysis Technique
Exponential smoothing stands out as a highly effective trend analysis technique, particularly valuable for aspiring entrepreneurs, startup founders, business innovators, small business owners, and market researchers. It's a time series forecasting method that deserves its place on this list due to its simplicity, adaptability, and efficiency in handling gradually evolving trends. This makes it a vital tool for anyone looking to understand and predict future patterns.
How It Works:
Unlike simple moving averages that give equal weight to all past data points, exponential smoothing assigns exponentially decreasing weights to older observations. This means recent data carries more influence in the forecast, making the method highly responsive to emerging trends. Imagine trying to predict the popularity of a new product – recent sales figures are much more relevant than those from months ago. Exponential smoothing captures this intuition mathematically.
Exponential smoothing exists in various forms:
- Simple Exponential Smoothing: Suitable for data without a clear trend or seasonality, such as predicting stable demand for a basic commodity.
- Double Exponential Smoothing (Holt's Method): Incorporates a trend component, making it ideal for analyzing data with a consistent upward or downward movement, like tracking the growth of a social media platform.
- Triple Exponential Smoothing (Holt-Winters): Adds a seasonality component, perfect for data exhibiting cyclical patterns, such as predicting seasonal sales fluctuations for clothing or holiday items. State space models, particularly ETS (Error, Trend, Seasonality) models, provide a robust statistical framework for these smoothing methods.
Features and Benefits:
- Adaptability: Quickly adjusts to shifts in data patterns, making it invaluable in dynamic markets.
- Efficiency: Requires fewer data points than some other methods, making it suitable for startups and new businesses with limited historical data.
- Scalability: Computationally efficient, even with large datasets, allowing for analysis of extensive market data.
- Versatility: Different variants handle diverse data characteristics, from stable demand to trending growth and seasonal variations.
Pros and Cons:
| Pros | Cons |
|---|---|
| Intuitively easy to understand and implement | Less suitable for irregular patterns or rapid changes |
| Adapts quickly to changing data patterns | Selecting optimal smoothing parameters can be challenging |
| Requires fewer data points | May not perform well with highly volatile data |
| Computationally efficient | Simple versions can't model complex seasonal patterns |
| Various variants handle diverse data | Provides limited insight into causal factors |
Examples of Successful Implementation:
- Inventory Management: Predicting product demand to optimize stock levels and minimize waste.
- Financial Analysis: Forecasting stock price movements to inform investment strategies.
- Manufacturing: Projecting production needs based on anticipated demand and seasonal variations using Holt-Winters methods.
Actionable Tips for Implementation:
- Parameter Optimization: Utilize information criteria (AIC, BIC) or cross-validation techniques to determine the optimal smoothing parameters for your data.
- Model Selection: Apply simple exponential smoothing for flat patterns, double for trends, and triple for seasonal data. Consider ETS models for automated model selection.
- Performance Monitoring: Regularly track forecast errors to identify when model adjustments are needed. Compare results with other forecasting methods like ARIMA to ensure you're using the most appropriate technique.
Why Exponential Smoothing Matters:
In today’s rapidly changing business environment, understanding trends is crucial for success. Exponential smoothing empowers you to analyze data, anticipate future patterns, and make informed decisions. Whether you're forecasting sales, managing inventory, or analyzing market dynamics, this powerful technique provides a practical and effective way to gain valuable insights from your data. Developed and refined by Charles Holt, Peter Winters, and Rob Hyndman, exponential smoothing has become a cornerstone of time series analysis and a valuable addition to any trend analysis toolkit.
6. Pattern Recognition and Machine Learning
Pattern recognition and machine learning represent a powerful set of trend analysis techniques that leverage algorithms to identify complex patterns, relationships, and trends within data. Unlike traditional statistical methods, these techniques excel at uncovering non-linear relationships and adapting to evolving patterns, making them particularly valuable for navigating the complexities of modern trend analysis. This approach involves training algorithms on large datasets to recognize patterns and then using these trained models to predict future trends or classify new data. These techniques are increasingly popular for complex trend analysis challenges in various fields, earning their spot as a crucial tool for anyone looking to understand and capitalize on emerging trends.

This approach employs a variety of powerful algorithms, including neural networks, random forests, gradient boosting machines, and support vector machines. These methods can incorporate multiple variables and diverse data types, both structured and unstructured, providing a holistic view of the data landscape. A crucial aspect of this process is the use of training and testing methodologies. The data is split into training and testing sets. The algorithm learns the patterns from the training data, and its performance is then validated on the testing data, ensuring the model's accuracy and preventing overfitting. Often, a combination of supervised and unsupervised learning approaches is employed to maximize insight extraction.
Examples of Successful Implementation:
- Google's search trend analysis: Google uses machine learning to identify emerging search patterns, providing valuable insights into evolving user interests and behaviors.
- Financial institutions: Deep learning algorithms are employed to detect market trend changes and identify potential trading opportunities, enabling more informed investment decisions.
- Healthcare systems: Pattern recognition helps identify disease outbreak trends by analyzing various data sources, including patient records, social media activity, and environmental factors.
Actionable Tips for Aspiring Entrepreneurs and Business Innovators:
- Start simple: Begin with simpler algorithms before exploring complex neural networks. This allows you to gain familiarity with the process and gradually increase complexity as needed.
- Cross-validation: Employ cross-validation techniques to prevent overfitting and ensure your model generalizes well to new data.
- Feature engineering: Carefully select and engineer relevant features to improve model performance.
- Ensemble methods: Consider using ensemble methods, which combine multiple algorithms, to increase the robustness and accuracy of your predictions.
- Balance complexity and interpretability: Choose the right level of complexity based on your specific needs. While complex models can offer high accuracy, simpler models might offer better interpretability.
- Retrain regularly: Regularly retrain your models as new data becomes available to maintain accuracy and capture evolving trends.
Pros and Cons:
Pros:
- Identifies complex, non-linear patterns missed by traditional methods.
- Effectively handles high-dimensional data.
- Adapts to changing patterns through retraining.
- Integrates diverse data sources (text, images, numerical).
- Often provides superior predictive accuracy.
Cons:
- Requires substantial data volume for training.
- Can be computationally intensive.
- Often acts as a "black box" with limited interpretability.
- Prone to overfitting without proper validation.
- Requires specialized expertise.
Learn more about Pattern Recognition and Machine Learning This link, while not directly related to pattern recognition in trend analysis, can provide context on product development processes that benefit from such analysis. Understanding these processes helps demonstrate the practical application and value of integrating trend analysis techniques like pattern recognition into business strategies.
This method is particularly suited for scenarios involving large datasets, complex relationships, and the need for predictive accuracy. If you are dealing with a dynamic environment where trends shift rapidly, pattern recognition and machine learning provide the adaptability needed to stay ahead of the curve. For aspiring entrepreneurs, startup founders, and business innovators, mastering these trend analysis techniques provides a competitive edge by enabling data-driven decision-making, improved forecasting, and the identification of emerging opportunities.
7. Wavelet Analysis: Riding the Waves of Trend Data
Wavelet analysis is a powerful trend analysis technique that offers a unique approach to dissecting time series data. Unlike traditional methods that might struggle with complex, fluctuating patterns, wavelet analysis excels at identifying both gradual and abrupt shifts in trends across multiple timescales. This makes it a valuable tool for anyone working with dynamic data, from aspiring entrepreneurs tracking market shifts to established business owners monitoring sales performance. If you're looking for deep insights into your data's underlying trends, wavelet analysis might be the answer.
How it Works: A Symphony of Time and Frequency
Imagine trying to understand a piece of music by only looking at the sheet music (frequency) or only listening to the performance (time). Wavelet analysis gives you both. It decomposes time series data into different frequency components, but also shows you when these frequencies occur. This is achieved by using wavelets, which are small wave-like oscillations of finite duration. These wavelets act like a microscope, allowing you to zoom in and out to examine trends at different scales, from broad, overarching movements to short, sharp fluctuations. This "multi-resolution analysis" provides a more nuanced picture of the data's behavior compared to techniques like Fourier analysis, which only provide frequency information and struggle with non-stationary data (data where the statistical properties change over time).
Features and Benefits:
- Multi-Resolution Analysis: Examines trends at different scales simultaneously, offering a holistic view of the data.
- Time-Frequency Localization: Pinpoints both the frequency of a trend and its location in time, revealing when specific patterns emerge and disappear.
- Adaptability: Different wavelet families (e.g., Haar, Daubechies, Morlet) can be used to optimize the analysis for various data characteristics.
- Noise Reduction: Wavelet denoising helps to clean up your data, making it easier to identify genuine trends and anomalies.
Pros:
- Excellent for Non-Stationary Data: Effectively analyzes data with changing patterns, like stock prices or fluctuating sales figures.
- Multi-Scale Trend Identification: Reveals both large-scale trends and subtle, short-term variations.
- Anomaly Detection: Highly effective at identifying temporary events and unexpected shifts in patterns.
- Robust to Noise: Less susceptible to interference from noisy data than some other methods.
Cons:
- Complexity: The underlying mathematics can be challenging, and interpretation of results often requires specialized knowledge.
- Wavelet Selection: Choosing the right wavelet family requires careful consideration and potentially some experimentation.
- Computational Demands: Can be resource-intensive for very large datasets.
Examples:
- Market Analysis: Financial analysts use wavelet analysis to identify market cycles, understand stock volatility, and make more informed investment decisions.
- Sales Forecasting: Business owners can leverage wavelets to analyze sales data, identify seasonal trends, and predict future demand.
- Product Development: Understanding evolving customer preferences and product lifecycles through wavelet analysis of market research data.
Tips for Implementation:
- Start with CWT: The continuous wavelet transform (CWT) is a good starting point for exploratory analysis.
- Consider DWT for Efficiency: The discrete wavelet transform (DWT) is more computationally efficient for detailed decomposition.
- Choose the Right Wavelet: The optimal wavelet family depends on the characteristics of your data (e.g., smooth, discontinuous).
- Denoise Your Data: Applying wavelet denoising can significantly improve the accuracy of your trend analysis.
- Combine with Other Methods: Wavelet analysis can be powerful when combined with other trend analysis techniques for a more comprehensive understanding.
Wavelet analysis deserves a place on this list of trend analysis techniques because it provides a unique perspective on time series data. Its ability to reveal both the "what" and the "when" of trend changes makes it an invaluable tool for anyone seeking deeper insights into complex data patterns. While it might require a steeper learning curve than some other methods, the potential rewards in terms of enhanced trend understanding and more informed decision-making make it a worthwhile investment for aspiring entrepreneurs, business innovators, and market researchers.
8. Trend Impact Analysis (TIA)
Trend Impact Analysis (TIA) stands out among trend analysis techniques because it goes beyond simply extrapolating historical data. Instead, it actively considers how future events might reshape existing trends. This forward-looking approach makes it invaluable for strategic planning, risk management, and long-range forecasting, especially in rapidly changing environments. If you're an aspiring entrepreneur, startup founder, or business innovator, understanding TIA can provide a significant edge in anticipating market shifts and preparing for potential disruptions.
Instead of relying solely on statistical models, TIA incorporates expert judgment, scenario planning, and qualitative assessments. This allows you to evaluate how emerging factors – technological advancements, regulatory changes, social movements, or even "black swan" events – could cause deviations from established trend lines. Essentially, TIA helps you answer the question: "What if?"
How TIA Works:
TIA combines quantitative trend extrapolation with qualitative expert opinions. The process typically involves:
- Identifying potential future events: Brainstorming and researching factors that could disrupt current trends.
- Assigning probabilities and impact magnitudes: Estimating the likelihood of each event occurring and the potential impact on the trend.
- Creating scenario-based forecasts: Developing multiple possible future scenarios based on different combinations of events and their potential impacts. This contrasts with single-point predictions, which can be misleading in dynamic environments.
- Gathering qualitative inputs: Often employing methods like the Delphi method or expert panels to collect informed opinions and insights.
Examples of TIA in Action:
Several organizations successfully utilize TIA principles:
- Royal Dutch Shell: Uses scenario planning based on TIA to anticipate energy market disruptions and develop robust strategies.
- Government Agencies: Employ TIA for disaster preparedness and response planning, considering various potential disaster scenarios.
- Healthcare Organizations: Utilize TIA to anticipate changes in disease patterns and healthcare demand, informing resource allocation and infrastructure development.
Benefits of Using TIA:
- Foresight beyond Statistics: TIA accounts for future discontinuities and "what if" scenarios that purely statistical methods often miss.
- Integration of Expertise: Incorporates valuable human expertise and domain knowledge into the trend analysis process.
- Contingency Planning: Produces a range of possible outcomes, which is crucial for effective contingency planning.
- Proactive Disruption Management: Helps organizations prepare for and potentially mitigate the impact of future disruptions.
- Structured Data Integration: Provides a structured approach to combining quantitative and qualitative data for a more comprehensive analysis.
Challenges of Implementing TIA:
- Subjectivity and Bias: Relies on expert opinions, which can be subjective and potentially biased.
- Validation Difficulty: Difficult to validate the accuracy of TIA predictions until the future events actually unfold.
- Resource Intensive: Can be time-consuming and require significant resources to implement effectively.
- Expert Selection: Requires careful selection of expert participants to ensure diverse perspectives and relevant expertise.
- Unforeseen Events: May struggle with truly unpredictable "black swan" events that are not anticipated by experts.
Tips for Effective TIA:
- Diverse Expert Panels: Use diverse expert panels to minimize individual biases and broaden the range of perspectives.
- Structured Elicitation Techniques: Incorporate structured methods like the Delphi technique for systematic expert opinion collection.
- Regular Updates: Regularly revisit and update TIA analyses as new information becomes available and the environment evolves.
- Documentation: Maintain historical documentation of past TIA analyses to learn from previous assessments and improve future accuracy.
- Quantitative Baseline: Combine TIA with quantitative trend analysis methods for establishing a baseline understanding of historical patterns.
- "Wild Card" Category: Consider creating a "wild card" category for low-probability, high-impact events to account for unforeseen disruptions.
Learn more about Trend Impact Analysis (TIA)
TIA deserves a place on this list of trend analysis techniques because it adds a crucial layer of foresight and preparedness. By considering potential future disruptions and their impact on current trends, TIA empowers businesses and organizations to make more informed decisions, develop robust strategies, and navigate the uncertainties of a dynamic future. It's a powerful tool for anyone seeking to not just understand the present, but also anticipate and shape the future.
Trend Analysis Techniques Comparison
| Technique | Implementation Complexity 🔄 | Resource Requirements ⚡ | Expected Outcomes 📊 | Ideal Use Cases 💡 | Key Advantages ⭐ |
|---|---|---|---|---|---|
| Moving Average Analysis | Low 🔄🔄 | Low ⚡⚡ | Smoothed trends, noise reduction, basic trend signals | Financial markets, sales forecasting, economic analysis | Simple, adaptable, effective for trend direction |
| Regression Analysis | Medium 🔄🔄🔄 | Medium ⚡⚡ | Quantified relationships, predictions, statistical confidence | Economics, marketing, climate studies | Quantifies trends, handles multiple variables |
| Seasonal Decomposition | Medium-High 🔄🔄🔄 | Medium ⚡⚡ | Decomposed trend, seasonal & cyclical components | Seasonal data (retail, energy, tourism) | Isolates seasonality, improves forecasting |
| ARIMA | High 🔄🔄🔄🔄 | Medium-High ⚡⚡ | Accurate forecasts with confidence intervals | Economic forecasting, finance, demand prediction | Flexible, statistically sound, models complex patterns |
| Exponential Smoothing | Low-Medium 🔄🔄🔄 | Low ⚡⚡⚡ | Adaptive trend and seasonality forecasts | Inventory management, financial forecasting, production | Easy to implement, efficient, handles trends & seasonality |
| Pattern Recognition & Machine Learning | Very High 🔄🔄🔄🔄🔄 | High ⚡⚡⚡ | Complex pattern detection, high predictive accuracy | Complex, high-dimensional data, dynamic trend analysis | Detects non-linear patterns, adaptable, powerful |
| Wavelet Analysis | High 🔄🔄🔄🔄 | Medium-High ⚡⚡ | Multi-scale trend and anomaly detection | Non-stationary data, finance, geophysics, climate | Multi-resolution, time-frequency detail |
| Trend Impact Analysis (TIA) | High 🔄🔄🔄🔄 | Medium ⚡⚡ | Scenario-based forecasts incorporating expert judgment | Strategic planning, risk management, long-range forecasting | Accounts for future disruptions, combines qualitative & quantitative data |
From Insight to Action: Leveraging Trend Analysis for Success
Trend analysis techniques, from simple moving averages to complex machine learning algorithms, provide a crucial lens for understanding the ever-shifting landscape of the market. This listicle explored eight powerful methods, including regression analysis, seasonal decomposition, ARIMA, exponential smoothing, pattern recognition, wavelet analysis, and Trend Impact Analysis (TIA), each offering unique insights into different aspects of trend identification and interpretation. Mastering these trend analysis techniques empowers you to anticipate market shifts, identify emerging opportunities, and make data-driven decisions, giving you a significant competitive advantage. Whether you’re a startup founder, small business owner, or market researcher, understanding these core concepts can transform how you approach strategy and innovation.
The most important takeaway is that effective trend analysis isn't just about identifying trends; it's about understanding their implications and acting on them. By accurately forecasting future trends, you can proactively adapt your strategies, optimize resource allocation, and mitigate potential risks. Ultimately, leveraging these techniques enables you to move from reactive decision-making to proactive strategizing, positioning you for long-term success in a dynamic environment.
Ready to transform your trend analysis and uncover data-backed insights into emerging market opportunities? Explore Business Ideas DB (Business Ideas DB) for curated data and resources that complement your trend analysis techniques, empowering you to make even more informed decisions and navigate the path to success.
Explore More Ideas
Want more ideas like this? Check out Business Ideas DB for consumer app ideas backed by market research.
Explore Ideas